

Being part of one of the leading software companies is great and brings advantages and sometimes disadvantages. A key element I like so much in my work, is that with my company I can be part of large - or even huge - scaled analytics journeys. Customers and BI competence centers who need to serve thousands and thousands of users. And in today’s digital economy they all struggle similar challenges. Let us focus on the business users and reflect their biggest requirements for analytics, and how this often brings us into the self-service dilemma.
Enterprise end users require at least
Self-service capabilities: business users require a great autonomy in their analytics work. They want to easily create, deploy and share their business analytics content themselves without being too reliant on their ICT or BI Competence Centers. The data analysts amongst them even require to access non-corporate data themselves in order to blend this to the corporate data and search for new insights.
Agility & Flexibility: almost becoming a magical word, agility is what I hear every user talking about. Users nowadays require full flavor flexibility when using analytics. It means easy accessible on any device, the ability to change graph types on the fly. It also means being able to swap measures and attributes at any place in the analytics dashboard, storyboard or report. The also require drill-anywhere capabilities and a definite must-have is to drill to the transactional level if applicable. The agility requirements for tooling come from the agility business decision makers need to have towards process or market fluctuations and their customer needs.
Online or real-time information, yet still highly performant. As you already expected, all the users I met jointly want the data to be accessible in real-time and ideally also online. I understand that need; driven by the above agility, users absolutely need to have the latest data to respond to any fluctuation in process or market
Consistency in metrics and metadata: though a no-brainer, users massively mention to have had negative experiences in the past with consistency in metrics and metadata. In any type of business analytics applications (reports, storyboard, workspaces or dashboards) they expect consistency in metrics, the use of definitions, hierarchies, prompts variables or other metadata-related content. End of the line!
Governed: oh yes, end users do concern about governance. Though everybody always wants to have access to anything, deep in their hearts they all understand authorizations and security are top notch subjects and need to be treated with ultimate care. Another one here is SSO (Single Sign On): would you like to logon and enter your credentials 75 times per day … nah, don’t think so, so SSO is a must-have
Visually appealing: basically I am talking the user experience here. Since analytics are widely spread – often also to my customer’s customers – it needs to be visually appealing to attract the attention. This element of visually appealing analytics is more complex than you might think. The visualizations need to have the creativity, effect and structure to exactly communicate the message that “needs to be communicated” … this is worth a few articles already.
But there are more players here: ICT or a BI competence center need to maintain the analytics platform, ensure standards and guidelines, or assist in ad hoc analytics. Also, large enterprises still have huge amounts of automated analytics. Reports or dashboards that are more or less fixed, and need to be distributed at regular intervals. These need to be managed: hence the need for “managed” reporting and dash boarding. And not the least: the consistency and governance our end users require, need to be deployed somewhere.
The self-service dilemma
So, here we are with the large enterprise using SAP BusinessObjects Suite and users looking for self-service and agility. Typically now the self-service dilemma starts: users, architects and IT leaders are all very well informed these days, and consider SAP Lumira as the ultimate tool to provide for every end user. And they have a point considering so: end users get full flexibility and self-service capabilities whilst the learning curve is extremely low. It brings powerful visualization capabilities and people can easily blend their data with other – i.e. external – data. A detailed component selection tool can be found here.
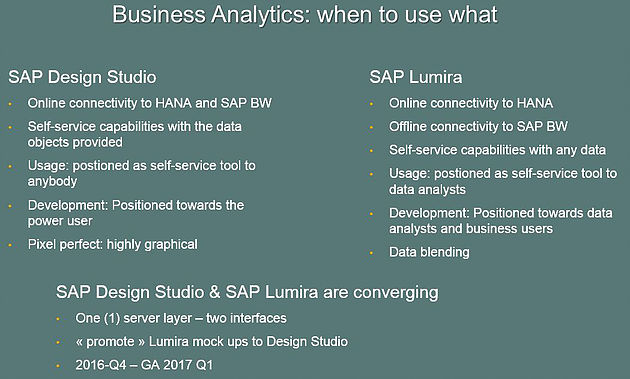
I tend to challenge their considerations especially if SAP BW and/or SAP HANA are involved. They forget about SAP Design Studio for enterprise dash boarding, and I don’t know why. Apparently they still believe SAP Design Studio is a developer tool and that is permanently incorrect. In a lot of cases SAP Design Studio can cover all the end user needs mentioned above, and it does this in a remarkable powerful way as you can find over here. SAP Lumira really comes in for data analysts. It is a matter of clearly choosing the best suiting SAP BI component to sort out the self-service dilemma enterprises might have. Let me explain you how.
Self-service on corporate data
To lead the discussion regarding self-service and the most appropriate SAP BusinessObjects component(s) to be used, a key element is whether the users require to run self-service BI on their corporate data (i.e. HANA Views or BW Queries and Infoproviders) solely, or that they – next to analyzing corporate data – also need to blend corporate data with other data sources (i.e. data data comes from outside the organization, or data that is non-corporate data). When users only need to analyze corporate data, it will be important for them to have the data in real-time and to have online connections to their data. They probably also require to have access to the lowest level of detail – transactional level – if they'd need to analyze that. In that case SAP Design Studio is perfectly suited for them: it is completely HTML 5 ready, can be accesses via a browser, has online connectivity to even transactional level, stunning visualizations and can be used via any mobile device if needed.
Users that need to have access to non-corporate data, like external data or data that is not part of the enterprise corporate systems, require SAP Lumira and/or SAP Analysis for Office on top off Design Studio. Lumira brings this tremendous capabilities for data blending, data mashup and cleansing. Often theses type of users are the company's data analysts.
Example
Let me give you an example of what I am trying to explain here: imagine we have a dashboard application providing analytical insights on purchasing information. The dashboard covers every purchase order detail – another stigma that leads our world is that dashboards cannot cover detailed information: wrong, they perfectly can – and provides insights in spend analysis, vendor optimization and vendor fraud detection for example. The user can slice and dice any data type, drill into details and also get KPI information including trends and thresholds.
Now imagine one of our users wants to focus on a specific vendor and requires to combine the dashboard data with from i.e. Dun & Bradstreet to verify the vendor's financial credibility. The data is in an external system where the user has access to, but it is not part of the Design Studio dashboard. This is the moment where our user or analist, steps aside to Lumira or Analysis for Office. With a single click in Design Studio, the data is brought within Lumira where our user can easily blend the purchasing data with the Dun & Bradstreet data set and start analyzing the situation, create a storyboard and share this on the BusinessObjects platform. Below is a video where I tried to simulate a similar example with a user of a dashboard requiring to blend the Design Studio data with external Reuters data. We call this the closed loop with SAP BusinessObjects Enterprise. Watch this video explaining the closed loop.
So Yes
So Yes, SAP Design Studio applications should best be built by experienced analytics architect. And No, there is not much coding anymore to do !! Have a look here, if you would still doubt that, and I'll make sure to convince you.
But, as long as our user needs to work with corporate data, or in other words needs to only work with the data objects provided through the application, Design Studio is very, very well suited. In the example of SAP BW, it means that if the user only needs to analyze the data that is part of the Bex query(ies) or Infoprovider(s), Design Studio is often the best suiting solution.
- users have online connectivity to their corporate data even onto transactional level
- visual perfectness based on HTML5 lay-out
- countless chart and graph types, including GEO spatial, waterfall
- open to third party extensions
- slide and dice of data, drill-anywhere via cross-tab boards
- users can create their own storyboards from within the Design Studio application
- wide range of interactivity controls from drop-down boxes onto interactive charts and the ability for users to change graph types and select the attributes on a chart
- threshold and trend indicators
- high level of interactivity with the dashboard
- supports any mobile device
- templates that allow to connect to SAP HANA, BW and Bex/Infopriders with a single click so users immediately start analysing
Most of the above functionalities are reflected in a video showing the capabilities of SAP Design Studio. I dare to firmly state that – if used on corporate data – Design Studio offers tremendous and flexible self-service capabilities in a managed and governed way offering enterprises to serve huge amounts of users.
Click, click and click: voila the enterprise dashboard is there
An excellent way to get your users using Design Studio applications, are to use the embedded templates. With just a few clicks, your key developer creates an application that allows users to:
- select the data source (i.e. HANA View, BW Infoprovider or Bex Query, or even a Universe
- filter data, drag & drop and drill-down
- create graphs and charts
- bookmark and store their analyses for use in composition dashboards
- explore any detail of their data source
Ah, you don't believe me? Have a look at this video and come back to me if you have any concerns left!
And Next?
So what is the really (!) good news? SAP Design Studio and SAP Lumira are about to converge into one product. You'll find more info on the convergence in this document. Apart from all the great advantages this brings to us, it will save you as a customer from the self-service dilemma. Everything your users require, is in there: discussion closed.


27 t/m 29 oktober 2025Praktische driedaagse workshop met internationaal gerenommeerde trainer Lawrence Corr over het modelleren Datawarehouse / BI systemen op basis van dimensioneel modelleren. De workshop wordt ondersteund met vele oefeningen en pra...
29 en 30 oktober 2025 Deze 2-daagse cursus is ontworpen om dataprofessionals te voorzien van de kennis en praktische vaardigheden die nodig zijn om Knowledge Graphs en Large Language Models (LLM's) te integreren in hun workflows voor datamodel...
3 t/m 5 november 2025Praktische workshop met internationaal gerenommeerde spreker Alec Sharp over het modelleren met Entity-Relationship vanuit business perspectief. De workshop wordt ondersteund met praktijkvoorbeelden en duidelijke, herbruikbare ri...
11 en 12 november 2025 Organisaties hebben behoefte aan data science, selfservice BI, embedded BI, edge analytics en klantgedreven BI. Vaak is het dan ook tijd voor een nieuwe, toekomstbestendige data-architectuur. Dit tweedaagse seminar geeft antwoo...
17 t/m 19 november 2025 De DAMA DMBoK2 beschrijft 11 disciplines van Data Management, waarbij Data Governance centraal staat. De Certified Data Management Professional (CDMP) certificatie biedt een traject voor het inleidende niveau (Associate) tot...
25 en 26 november 2025 Worstelt u met de implementatie van data governance of de afstemming tussen teams? Deze baanbrekende workshop introduceert de Data Governance Sprint - een efficiënte, gestructureerde aanpak om uw initiatieven op het...
26 november 2025 Workshop met BPM-specialist Christian Gijsels over AI-Gedreven Business Analyse met ChatGPT. Kunstmatige Intelligentie, ongetwijfeld een van de meest baanbrekende technologieën tot nu toe, opent nieuwe deuren voor analisten met ...
8 t/m 10 juni 2026Praktische driedaagse workshop met internationaal gerenommeerde spreker Alec Sharp over herkennen, beschrijven en ontwerpen van business processen. De workshop wordt ondersteund met praktijkvoorbeelden en duidelijke, herbruikbare ri...

Deel dit bericht