


A data warehouse is a relational database just like any other relational database. However, the database model is designed in a different way. It should facilitate business users querying large amounts of data, but also let them explore the data from different points-of-view by means of BI applications. Six steps will guide you through the design process and address some key fundamentals in data warehouse modeling. Finally, five additional tips will help you save time and money with future enhancements of your data warehouse solution.
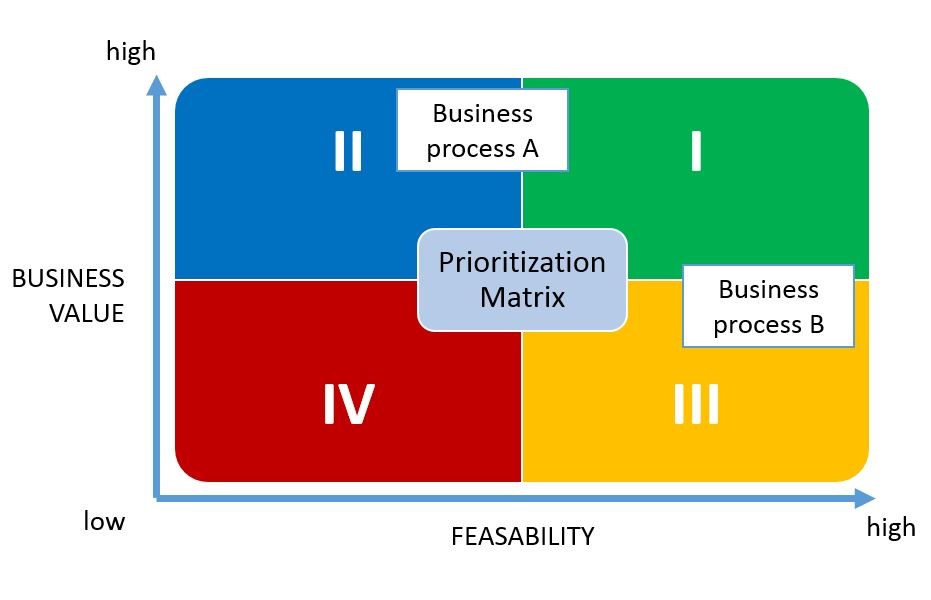
Identify candidate business processes that you want to see covered by your data warehouse. These are the business processes that your key users want to analyze and run reports on. There may be several processes put forward by different stakeholders, e.g. product sales, production quality control, consumption of energy, helpdesk issue management. It is important to identify all of the processes, but you should not try to have each one of them implemented at once. You can use a prioritization matrix to help you choose which project to model first. In the ideal situation you start with the process that has a high business value and is feasible both to realize for the IT department and to introduce in your organization.
Once you have chosen your business process, you describe it in terms of measures. The most trivial measure is the counting measure. Each process cycle can be counted. Depending on the size and type of business some of the process cycles can be counted on a daily basis, such as sales processes, others on a yearly basis, like marketing budget allocations. Besides this counting measure, most processes can be further described by other measures such as its cost, profit, duration, spatial volume, et cetera. How much did that sale cost ? How many liters of milk were produced ? All the measures that describe the same process, can be grouped into a so-called fact table.
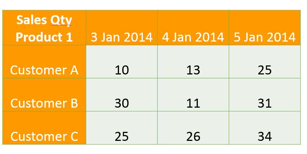
A measure has no meaning on its own. The number 1000 does not tell you much. You need to interprete numbers in their proper context. This is where dimension attributes come into play. Sales amounts are relevant for products, and for customers, on a given date, and maybe for sales representatives. These contextual nouns are called dimension attributes. The values of these attributes can be used to filter your measures, to drill-down/up and to categorize measures in columns or rows. In the grid below, you’ll see an example of a sales quantity measure described in the context of three dimension attributes: product, date and customer.
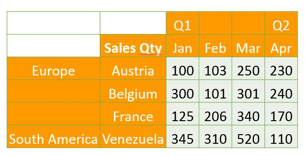
Likely, you can provide more interesting information for your dimension attributes. A customer also has a name and resides at a location. A product may have a color, and belongs to a product category. A date is part of a month and a year. These related attributes can be grouped into so-called dimension tables, and are in turn very handy when you filter, drill-down/up, or categorize your data.
Now that you have identified dimension attributes, you can design the proper dimension tables. Each dimension table consist of its business key attribute, the one that uniquely identifies a row in the table. The business key is the attribute that is known in the operational system by the business users. Along with the business key, the related attributes are put in place. The ETL, the process that uploads new data from the operational system, e.g. all product information, will look up the business key in the dimension table.
If the dimension member is already in the table, some related attributes may be updated, such as a change in color for a product, or if not, then the new member should be inserted into your dimension table.
Further, we will introduce a surrogate key in the dimension table, an identity column with automatically generated incremental values for each row that is inserted. The surrogate key will become the primary key of the table. The reason why, is explained further below. Your database administrator can help you with the implementation.
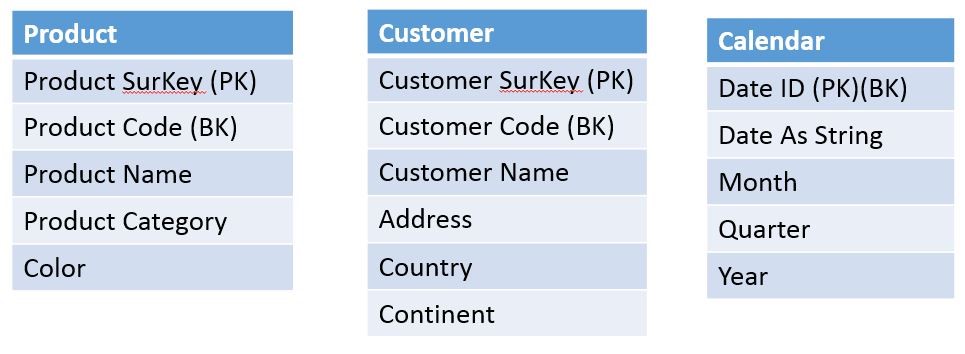
The Calendar dimension table contains all the dates from some point in the past up to some point in the future, e.g. 2000 Jan 1 – 2049 Dec 31, a period relevant to your business users. The business key here, can be defined as any data type, even a datetime data type. But for performance reasons, and for easy query development, an integer is provided taking the format YYYYMMD. An example: the date id 20140820 represents 2014 Aug 20. The calendar table is populated with records only once at the start of your data warehouse project.
Finally, we’ll define the fact table that will hold the measures of our sales process. Provide a column for every measure. Provide a column for every foreign key that links the measures to the corresponding dimension rows . Also here, a surrogate key is introduced in the fact table that will become the primary key of the table.
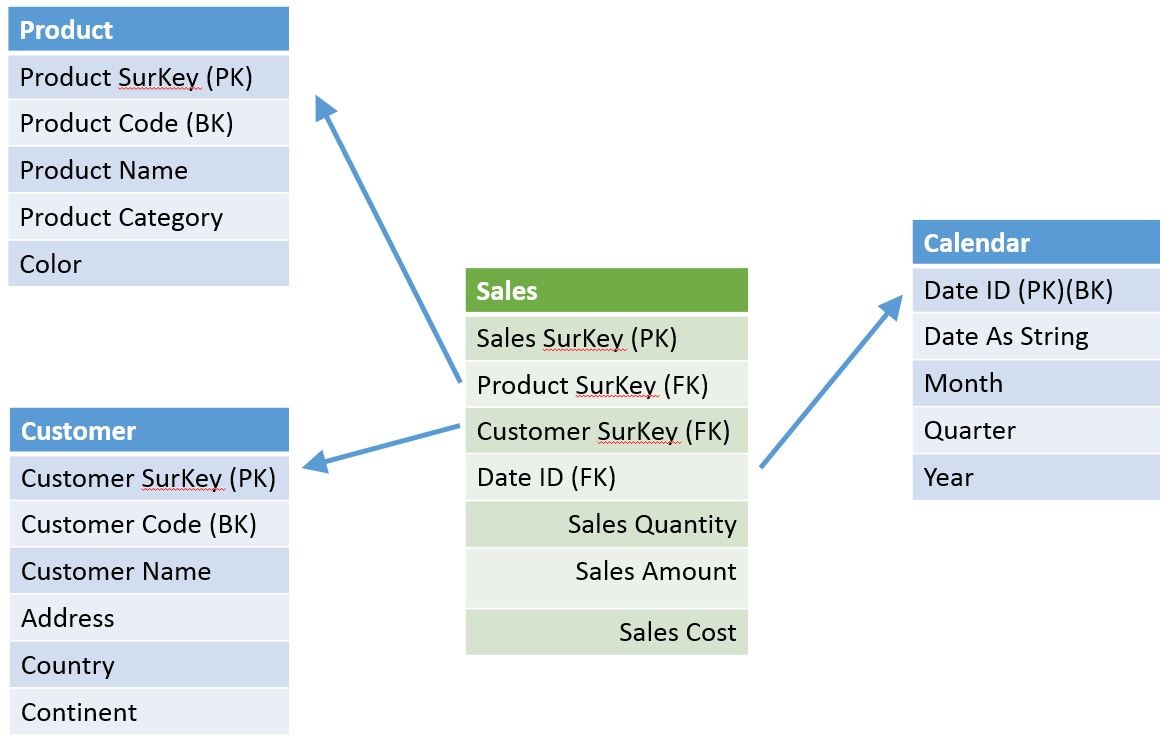
Well you’ll need them for a number of reasons:
Congratulations, you’ve just designed your first dimensional model. For the implementation of the model, please keep in mind the following five tips. Your users will stay happy.
Tip 1 : Use atomic detailed data in your dimension model
Most often, users don't need to see a single record at a time. Nevertheless you can't predict how they want to display and drill down into the details. When you introduce summarized data into the data warehouse, e.g. sales per region instead of sales per shop, then you make assumptions about data usage patterns. Sooner or later your users will not appreciate that. So model the facts on the lowest level.
Tip 2 : All facts in a single fact table are modeled at the same grain
Some might be tempted to fill the same fact table with measures from different types of processes, e.g. car production and automobile services, or maybe some may want to mix marketing budget allocations for single key products with budgets for entire product categories. When multiple levels of granularity are present in the same fact table you introduce not only user confusion but also erroneous results into the BI applications.
Tip 3 : Strive for conformed dimensions to integrate data across the organization
Conformed dimensions are dimensions that can be reused across multiple fact tables. They are managed once in the ETL system and support the ability to drill across and integrate data from multiple business processes. A product dimension table can be used with a sales fact table, but also in a production order fact table.
Tip 4 : Avoid NULLs, instead use special dimension members
NULLs, “empty values”, may lead to wrong result in calculations. Also, a NULL may be interpreted by business users in different ways :
To deal with these ‘null’ situations, we introduce special members in the dimension tables. The ETL process should map facts to the corresponding special members. These rows are defined once at the start of the project.
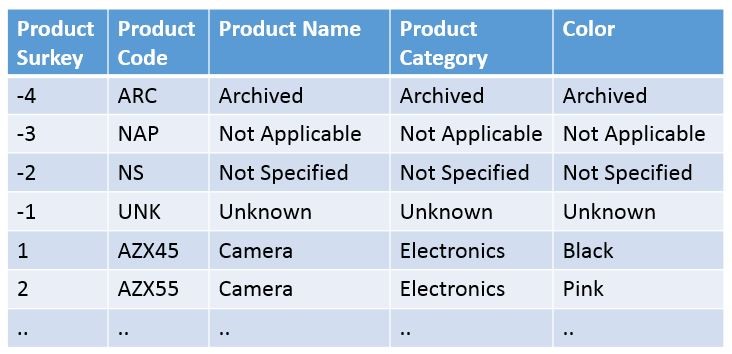
Below is an example of a dimension table with special members: Unknown, Not Applicable, Not Specified and Archived. The usage of the former three special members has just been explained. The latter one, Archived, comes in handy when you sooner or later need to upload facts from old historical data sets with missing dimension values and there is no way to retrieve those original values. E.g. old sales figures with date and customer codes but without product codes. Uploads of such historical datasets only occur once, and by using Archived members, you can easily distinguish these members from the others.
Tip 5 : Keep the data warehouse well performing and consistent.
You should consider your data warehouse as a library. You don’t want go through all the library’s bookshelves just to find one book. You expect all books to be neatly ordered by theme and stored in the corresponding bookshelf. Accordingly, have the data warehouse model implemented with indexes and foreign keys :
Implement the tables as clustered index structures with the primary key (our surrogate key) as the clustered index column. In some cases larger tables, sometimes implemented as a partitioned table, may require the cluster index key to be defined on another column, e.g. the date column.
Define a unique non-clustered index on the business key.
Define foreign key constraints.
Add non-clustered indexes to the foreign key columns.
If you are not familiar with these database terms, please ask us, or your database administrator, for further explanation.
Ready for your first data warehouse model ? I hope the six steps guide above and the additional tips may encourage you to further explore the path of dimensional modeling!


27 t/m 29 oktober 2025Praktische driedaagse workshop met internationaal gerenommeerde trainer Lawrence Corr over het modelleren Datawarehouse / BI systemen op basis van dimensioneel modelleren. De workshop wordt ondersteund met vele oefeningen en pra...
29 en 30 oktober 2025 Deze 2-daagse cursus is ontworpen om dataprofessionals te voorzien van de kennis en praktische vaardigheden die nodig zijn om Knowledge Graphs en Large Language Models (LLM's) te integreren in hun workflows voor datamodel...
3 t/m 5 november 2025Praktische workshop met internationaal gerenommeerde spreker Alec Sharp over het modelleren met Entity-Relationship vanuit business perspectief. De workshop wordt ondersteund met praktijkvoorbeelden en duidelijke, herbruikbare ri...
11 en 12 november 2025 Organisaties hebben behoefte aan data science, selfservice BI, embedded BI, edge analytics en klantgedreven BI. Vaak is het dan ook tijd voor een nieuwe, toekomstbestendige data-architectuur. Dit tweedaagse seminar geeft antwoo...
17 t/m 19 november 2025 De DAMA DMBoK2 beschrijft 11 disciplines van Data Management, waarbij Data Governance centraal staat. De Certified Data Management Professional (CDMP) certificatie biedt een traject voor het inleidende niveau (Associate) tot...
25 en 26 november 2025 Worstelt u met de implementatie van data governance of de afstemming tussen teams? Deze baanbrekende workshop introduceert de Data Governance Sprint - een efficiënte, gestructureerde aanpak om uw initiatieven op het...
26 november 2025 Workshop met BPM-specialist Christian Gijsels over AI-Gedreven Business Analyse met ChatGPT. Kunstmatige Intelligentie, ongetwijfeld een van de meest baanbrekende technologieën tot nu toe, opent nieuwe deuren voor analisten met ...
8 t/m 10 juni 2026Praktische driedaagse workshop met internationaal gerenommeerde spreker Alec Sharp over herkennen, beschrijven en ontwerpen van business processen. De workshop wordt ondersteund met praktijkvoorbeelden en duidelijke, herbruikbare ri...

Deel dit bericht