

Data Science has exploded over the past decade, changing the way that we conduct business and prepare the next generation of young people for the jobs of the future. But this rapid growth was coupled with a still evolving understanding of Data Science work, which has led to a lot of ambiguity toward how we can use Data Science to derive actionable insights from our piles of data.
Having had my own career shaped by the growth of Data Science, I wanted to dig into the questions of what Data Science is, what Data Science work is, and who data scientist are. I looked across the research literature to pull on threads of various studies and analyses of Data Science and data scientists to weave together answers to these questions.
Part of the motivation for this research was to serve as a foundation for research and development, so that I may identify areas with visual analytics tools that might address an unmet need. However, another motivation was personal reflection on a field that did not yet exist a little over a decade ago when I first began my advanced studies in computer science. In this blog post, I summarize several of the key takeaways from this research paper and share my thoughts on how its findings can help us build the next generation of data visualization tools for Data Science.
What is Data Science?
It turns out Data Science is different things to different people. To some individuals, Data Science is nothing new and is just the practical application of statistical techniques that have existed for a long time. To others, this view is too narrow as Data Science requires not only knowledge of statistical methods but also computation techniques to make the application of these methods practical.
For example, it’s not enough that a data scientist understands a linear regression, they also need to know how to apply it at scale to massive amounts of data. Still, even those who would argue that Data Science is more than applied statistics might still hesitate to say that it is something new. The practice of gathering and analyzing data, even large amounts of data, has long been a part of scientific research, for example in biology or physics; many feel that Data Science is just an extension of what has already been happening in empirical science.
But there is also a third perspective here, which is that Data Science really is something new and different both from statistics and also the approaches that scientists used when studying atoms and genes. Bringing together statistics and computer science with the necessary subject matter expertise has resulted in new challenges that are uniquely addressed by Data Science and that are tackled by data scientists. Moreover, the work carried out by data scientists is distinct from other types of data analysis, because it requires a wider breadth of multidisciplinary skills.
Our research, and others’, takes this perspective that Data Science really is something new and different and from this we created a working definition that serves as the foundation of our work: “Data Science is a multidisciplinary field that aims to learn new insights from real-world data through the structured application of primarily statistical and computational techniques”.
This definition is important because it helps us to understand the challenges and unmet needs of Data Science workers, which primarily stem from the challenges of work with real, as opposed to simulated, data and the challenges that accompany the application of statistical and computation methods to these data.
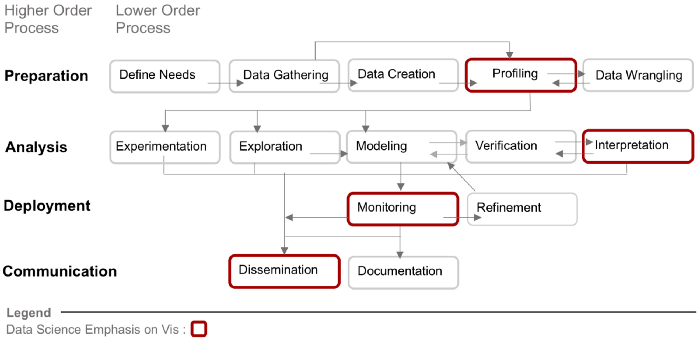
Distilling Data Science Work into four Higher Order (Preparation, Analysis, Deployment, and Communication) and 14 lower order processes. The processes outlined in red are those where data visualization is predominately used, but this doesn’t preclude its use in other aspects of Data Science work.
What is Data Science work?
Importantly, a working definition of Data Science narrows the scope of research. Instead of considering all possible types of data analysis that one may wish to conduct, we look closely at the types of analyses data scientists carry out. This distinction is important as the specific steps that, say, an experimental physicist takes to analyze data are different, even though they share commonalities, than the analytic steps a data scientist may take. Which leads to an important follow on: what exactly is Data Science work?
There have been several industry standards for breaking down Data Science work. The first was the KDD (or Knowledge in Data Discovery) method, that over time was modified and expanded upon by others. From these derivations, as well as studies that interview data scientists, we created a framework that has four higher order processes (preparing, analysis, deployment, and communication) and 14 lower order processes. We also highlighted the specific areas where data visualization already plays a prominent role in Data Science work.
Who are Data Science workers?
Over they years, I have heard many different takes of what a data scientist is. One take I enjoy is that a data scientist is someone who is ‘better at software engineering than a statistician, and better statistics than a software engineer”. A more recent tongue in cheek take I’ve heard is that data scientists is a “statistician on the west coast”.

Nine Data Science roles that we found across twelve in depth studies with Data Scientists.
However, as we dug into the studies something that we did not expect to find, but that emerged as consistent and important, was how diverse ‘data scientists’ were and how their roles changed in relation to specific Data Science processes. You may have noticed the rise of the data engineer, for example, as a distinct but still adjacent Data Science role. As Data Science work grew in complexity, data scientists became less generalized and more specialized, often engaged in specific aspects of Data Science work. Interviews conducted by Harris et al. as early as 2012 already identified this trend, which has only accelerated over time. Astutely, they observed that this diversity among the Data Science role leads to “miscommunication between data scientists and those who would seek their help”.
We built upon the results of Harris work by examining twelve studies totaling thousands of individuals that identified as data scientists. From our meta analysis of these studies, we were able to identify 9 distinct data roles. These individuals had different skill sets and backgrounds, which we illustrated along an axis of statistics, computer science, and domain expertise. We also included human centered design in our characterization of Data Science skills, as considering the impact of data products, like a facial recognition application, is of growing importance. We want to emphasize that these roles are not absolute categories, there is fluidity in their boundaries as well as with the technical skill strength of these individuals that occupy these roles. Instead, these categories of roles are intended to serve as guideposts to help researchers, and others, get a lower granularity sense of who they’re talking to and what their background may be.
How does this change the way we build visualization and data analysis tools?
Of course, the most important consideration is how our definition of Data Science and our framework of Data Science work and workers can help us build better data visualization tools. First and foremost, it helps by making the diversity of Data Science work and workers explicit and grounded in evidence. Already we have used this framework to create crisper criteria for breaking down Tableau customer experiences in Data Science. We can pinpoint with great precision exactly what they are trying to do and can ask more probing questions about those processes. Knowing that the role ‘data scientist’ itself included a great deal of diversity, we can better identify who is carrying out the work by classifying individuals we’re talking to into our nine Data Science roles. Such classification makes it easier to understand the tasks our visualization systems need to support and at what level.
For example, a technical analyst and ML/AI engineer, which are two Data Science roles we characterized, can both be engaged in a common task of model building, but have drastically different needs; if we ignore those differences, we risk building the wrong tool for both roles.
But perhaps most importantly to me, this framework also helps me think about what’s missing in the current ecosystem of visual analytics tools. One concerning conclusion I drew was the narrow focus of these tools toward visualizing machine learning models, and the lack of tools that support other critical aspects of Data Science work, such as data preparation, deployment, or communication. Not only does this lack of tooling add overhead to Data Science work, it also makes it more difficult for data scientists, in whatever role they hold, to have their work impact organizational decision making and practices. This research on Data Science work and workers has helped me surface these challenges and define opportunities for building better tools that help people see and understand their data.
Read the research paper: Anamaria Crisan, Brittany Fiore-Gartland, and Melanie Tory (2020), Passing the Data Baton: A Retrospective Analysis on Data Science Work and Workers.
Ana Crisan is Research Scientist at Tableau.


27 t/m 29 oktober 2025Praktische driedaagse workshop met internationaal gerenommeerde trainer Lawrence Corr over het modelleren Datawarehouse / BI systemen op basis van dimensioneel modelleren. De workshop wordt ondersteund met vele oefeningen en pra...
29 en 30 oktober 2025 Deze 2-daagse cursus is ontworpen om dataprofessionals te voorzien van de kennis en praktische vaardigheden die nodig zijn om Knowledge Graphs en Large Language Models (LLM's) te integreren in hun workflows voor datamodel...
3 t/m 5 november 2025Praktische workshop met internationaal gerenommeerde spreker Alec Sharp over het modelleren met Entity-Relationship vanuit business perspectief. De workshop wordt ondersteund met praktijkvoorbeelden en duidelijke, herbruikbare ri...
11 en 12 november 2025 Organisaties hebben behoefte aan data science, selfservice BI, embedded BI, edge analytics en klantgedreven BI. Vaak is het dan ook tijd voor een nieuwe, toekomstbestendige data-architectuur. Dit tweedaagse seminar geeft antwoo...
17 t/m 19 november 2025 De DAMA DMBoK2 beschrijft 11 disciplines van Data Management, waarbij Data Governance centraal staat. De Certified Data Management Professional (CDMP) certificatie biedt een traject voor het inleidende niveau (Associate) tot...
25 en 26 november 2025 Worstelt u met de implementatie van data governance of de afstemming tussen teams? Deze baanbrekende workshop introduceert de Data Governance Sprint - een efficiënte, gestructureerde aanpak om uw initiatieven op het...
26 november 2025 Workshop met BPM-specialist Christian Gijsels over AI-Gedreven Business Analyse met ChatGPT. Kunstmatige Intelligentie, ongetwijfeld een van de meest baanbrekende technologieën tot nu toe, opent nieuwe deuren voor analisten met ...
8 t/m 10 juni 2026Praktische driedaagse workshop met internationaal gerenommeerde spreker Alec Sharp over herkennen, beschrijven en ontwerpen van business processen. De workshop wordt ondersteund met praktijkvoorbeelden en duidelijke, herbruikbare ri...

Deel dit bericht