

It is no mystery anymore that data is the core asset for any modern organization. However, many businesses fail to manage their information efficiently. Analyst Gartner explains the key roles of a CDO in a company and how the individual is responsible for processing useful data in the most compelling ways. Among various Digital Transformation methods, Data visualization has emerged as an ultimate solution.
The significance of data for dynamic organizational growth is unquestionable. However, the real challenge is not the collection of data, but the extraction and projection of complex data in simplified and interesting mediums. That is where most of the CDOs struggle the most.
Experts state that almost 70 to 80 percent of the business failures occur due to incompatible interpretation and explanation of data by the department. Most of these failures are the result of the inability to detect crucial opportunities through data interpretation. This leads to financial setbacks and low yielding outcomes on the investment of resources.
The reason for data incompatibility and failure to get every individual on the same level of understanding is because most of the data-driven information is in a complex form of numeric figures, equations and mathematically driven spreadsheets which does not speak to everyone.
“90 percent of information transmitted to the brain is visual”. It is a common fact that the human mind can process visual data 60,000 times faster than compared to processing text or numeric data. Hence for companies that tend to evolve through data evaluation in competitive industries, data visualization is a necessity.
With the emergence of multiple research and real-life examples, data storytelling is becoming an essential aspect of corporate culture.
How does data visualization lead to better decision making?
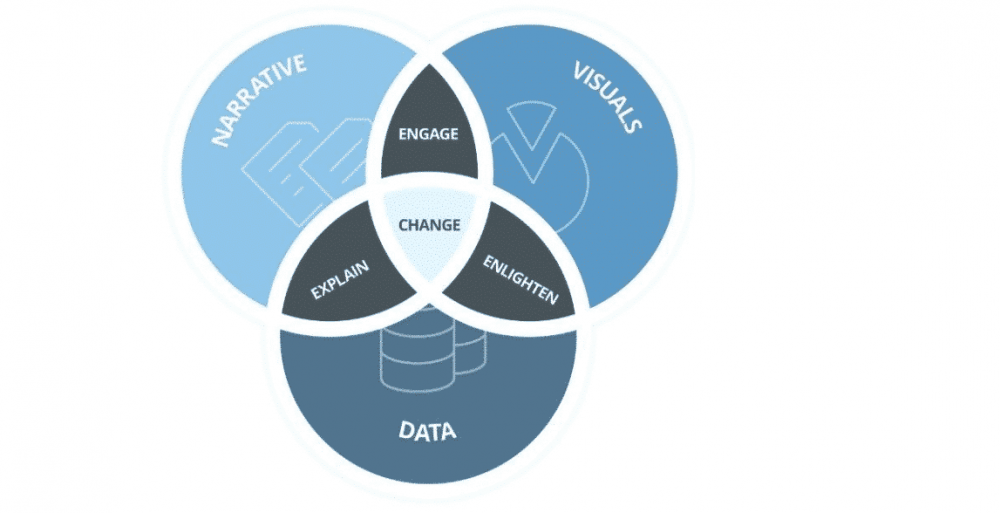
The phenomenon of data storytelling is comprised of multiple mediums that can illustrate important information-delivering authentic ideas. There are multiple visualization techniques such as infographics, illustrations, data with images, and intuitive graphics that highlight fundamental features.
If you choose the correct tool for your purpose, then data storytelling can lead to better decision making. A comprehensive collection of facts through data visualization has been proven to be one of the most effective methods for convincing a large group of people.
According to a study by GE Global Innovation Barometer, in more than 61% of companies, decision-making procedures involve in-depth data visualization by senior executives. The ratio has increased by 10 percent since 2014, as more and more companies have started to realize the importance of data visualization.
In addition, 41% of companies tend to take better initiatives to adopt data visualizations to improve the ability to derive valuable insights from the data.
KPI piloting and Data Management
The current condition of the worldwide economy has driven companies to one simple objective – do more for less. Data visualization of key performance indicators is quite the same thing. The system optimized key indicators measure different criteria of performance like sales, earnings, customer fulfillment, return on investments, human resources management, and cost control.
By using these indicators, CDOs can identify many factors which are crucial to maximize productivity, financial outcome and return on investment.
Identifying the sources of core strategy
KPIs are stored in various database platforms, portal, and applications to derive the most compelling and categorized view of data to identify strengths and weaknesses.
In simple terms, the ability of an organization to grow and succeed in innovative projects and initiatives is directly proportional to the excellence of data visualization among the employees, management, and decision-makers.
Cost Saving
Key Performance indicators allow enterprises to formulate methods of curtailing extra or unnecessary investments. By tracking each channel of funding individually, KPI projections assist CDOs in identifying uncommitted costs and financial drains.
Influence Potential Clients and Stakeholders
When in talks with potential clients or convincing stakeholders to sustain funding, CDO’s often put KPI findings in front of them. As KPI demonstrates the financial performance of a company clearly, it helps relevant authorities to compare and analyze to reach a decision.
Data Transformation through Visual Mediums Increases Employee Engagement
The transformation of complex data into visual indicators like financial dashboards, graphic reports and analytical graphs is frequently used to increase employee engagement.
As many organizations are approaching unique core strategies, simplified and engaging data presentation has become a necessity.
To make complicated numbers of revenue and performance understandable to all the individuals in the company, on every platform, whether they are in sales, marketing or management; companies are initiating data transformation through graphical storytelling.
Data visualization makes such reports absorbable for all employees, regardless of their level of understanding with analytics.
Transformation of dry, intricate data into interesting and highly acceptable digital mediums develops opportunities for improvements in productivity and growth.
How adopting data visualization reduced PepsiCo analysis time by 70 percent
PepsiCo is a world-famous beverage company that requires enormous volumes of data for accurate supply chain operations in over 200 countries. Balancing out such heavy supply stocking is a real challenge.
The company needs to collect warehouse, inventory and sales forecast reports from all its distributors and then sort their supply accordingly. A slight confusion among numbers can cause huge losses in the form of wasted resources or profit decrement. The company initiated data visualization to deliver correct data information to its employees for efficiency at-scale. The procedures through this transformation of data became faster, direct and more accurate. This saved the company 70% in data analysis time.
Mike Reigling, who is an analyst in PepsiCo’s Collaborative Planning, Forecasting, and Replenishment (CPFR) team explained the effect of this effective data transformation technique. “Now we’re not taking our time putting the data together; we’re spending our time analyzing the data, telling the story, and finding problems.”
Final thoughts
Business Leaders are prone to stay one step ahead of the market by recognizing possibilities to improve operations and increase revenues. To improvise new projects and sustain existing ones with maximum profit margin, CDOs, and decision makers require immediate access to relevant data and critical interpretations of the information.
Hence, the ever-changing business environment demands intelligent data storytelling that assists progress in terms of revenue, sales and productive outcomes.
- The prospect of increasing data-oriented initiatives and plans are inextricable from data visualization.
- The in-house operations require simplistic guides and indicators of data visualization to convey vital benchmarks and goals among employees.
– Executives, leadership, and staff across the organization must be able to grasp the core strategy and pattern on a similar level of understanding; so that the plan could be executed by each individual.
Visualization tools expedite revolutionary data transformation in organizations. The phenomenon impacts operations effectively pushing the company forward in the fast-paced market of today and into the future.
The choice of right data visualization tools for a particular task is as important as mining significant data.
The awareness of potential in data storytelling is increasing at a moderate pace. Soon it can take over the traditional ways of analytics and interpretation, boosting the power of data and information.


27 t/m 29 oktober 2025Praktische driedaagse workshop met internationaal gerenommeerde trainer Lawrence Corr over het modelleren Datawarehouse / BI systemen op basis van dimensioneel modelleren. De workshop wordt ondersteund met vele oefeningen en pra...
29 en 30 oktober 2025 Deze 2-daagse cursus is ontworpen om dataprofessionals te voorzien van de kennis en praktische vaardigheden die nodig zijn om Knowledge Graphs en Large Language Models (LLM's) te integreren in hun workflows voor datamodel...
3 t/m 5 november 2025Praktische workshop met internationaal gerenommeerde spreker Alec Sharp over het modelleren met Entity-Relationship vanuit business perspectief. De workshop wordt ondersteund met praktijkvoorbeelden en duidelijke, herbruikbare ri...
11 en 12 november 2025 Organisaties hebben behoefte aan data science, selfservice BI, embedded BI, edge analytics en klantgedreven BI. Vaak is het dan ook tijd voor een nieuwe, toekomstbestendige data-architectuur. Dit tweedaagse seminar geeft antwoo...
17 t/m 19 november 2025 De DAMA DMBoK2 beschrijft 11 disciplines van Data Management, waarbij Data Governance centraal staat. De Certified Data Management Professional (CDMP) certificatie biedt een traject voor het inleidende niveau (Associate) tot...
25 en 26 november 2025 Worstelt u met de implementatie van data governance of de afstemming tussen teams? Deze baanbrekende workshop introduceert de Data Governance Sprint - een efficiënte, gestructureerde aanpak om uw initiatieven op het...
26 november 2025 Workshop met BPM-specialist Christian Gijsels over AI-Gedreven Business Analyse met ChatGPT. Kunstmatige Intelligentie, ongetwijfeld een van de meest baanbrekende technologieën tot nu toe, opent nieuwe deuren voor analisten met ...
8 t/m 10 juni 2026Praktische driedaagse workshop met internationaal gerenommeerde spreker Alec Sharp over herkennen, beschrijven en ontwerpen van business processen. De workshop wordt ondersteund met praktijkvoorbeelden en duidelijke, herbruikbare ri...

Deel dit bericht