

We are excited to release Deep Learning for Anomaly Detection, the latest applied machine learning research report from Cloudera Fast Forward Labs.
Anomalies, often referred to as outliers, are data points or patterns in data that do not conform to a notion of normal behavior. Anomaly detection, then, is the task of finding those patterns in data that do not adhere to expected norms. The capability to recognize or detect anomalous behavior can provide highly useful insights across industries. Flagging or enacting a planned response when these unusual cases occur can save businesses time, money, and customers.
Automatically detecting and correctly classifying something unseen as anomalous is a challenging problem that has been tackled in many different manners over the years. Traditional machine learning approaches are sub-optimal when it comes to high dimensional data, because they fail to capture the complex structure in the data. This is where deep learning methods can be leveraged for the task.
Our report reviews a set of relevant deep learning model architectures including autoencoders, variational auto-encoders, generative adversarial networks and sequence-to-sequence methods, and addresses how they can be applied to the task of anomaly detection, comparing them in terms of training, inference and storage costs. Anomaly detection using each of these models is explored as a function of how they can be applied to first model normal behavior, and then this knowledge is exploited to identify deviations (anomalies). In the remainder of this blogpost, we’ll explore one of these approaches: autoencoders.
Anomaly Detection with Autoencoders
Autoencoders are neural networks designed to learn a low dimensional representation given some input data. They consist of two components: an encoder (which learns to map input data to a low dimensional representation, termed the bottleneck), and a decoder (which learns to map this low dimensional representation back to the original input data). By structuring the learning problem in this manner, the encoder network learns an efficient “compression” function which maps input data to a salient lower dimension representation, such that the decoder network is able to successfully reconstruct the original input data. The model is trained by minimizing the reconstruction error: the difference (mean squared error) between the original input and the reconstructed output produced by the decoder.
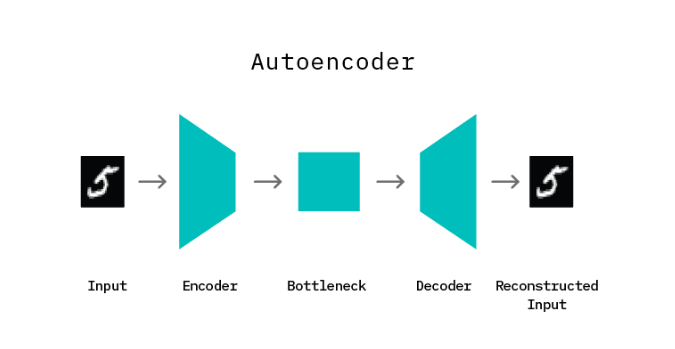
It is important to note that the mapping function learned by an autoencoder is specific to the training data distribution, i.e., an autoencoder will typically not succeed at reconstructing data which is significantly different from data it has seen during training. This property of learning a distribution specific mapping (as opposed to a generic linear mapping) is particularly useful for the task of anomaly detection.
Applying an autoencoder for anomaly detection follows the general principle of first modeling normal behaviour and subsequently generating an anomaly score for a new data sample. To model normal behaviour we train the autoencoder on a normal data sample. This way, the model learns a mapping function that successfully reconstructs normal data samples with a very small reconstruction error (the difference between the actual sample and the version reconstructed by the model). This behavior is replicated at test time, where the reconstruction error is small for normal data samples, and large for abnormal data samples. To identify anomalies, we use the reconstruction error score as an anomaly score and flag samples with reconstruction errors above a given threshold.
Anomagram – Identifying Anomalous Signals
To illustrate autoencoders with a concrete example, we present Anomagram. Anomagram is an interactive visualization that walks the user through steps required to apply a deep autoencoder model in identifying anomalies. Anomagram is created as both a learning tool and a prototype of what an ML product interface could look like.
The interface, which contains two main sections, is built with Tensorflow.js and allows install-free experimentation in the browser. The first part of the interface introduces important concepts (autoencoders, data transformations, thresholds) paired with appropriate interactive visualizations. Users can apply a trained autoencoder to test data from the ECG5000 dataset, and view how it assigns an anomaly tag based on a selected threshold. In addition, the user can craft (adversarial) input by drawing a signal and also observe how the model behaves.
The second part (pictured below) is geared towards users who are interested in additional technical depth and allows you to design, train, and evaluate an autoencoder model entirely in the browser. It provides a direct manipulation interface that allows the user to:
• specify a model (add/remove layers and units within layers)
• modify model parameters (training steps, batchsize, learning rate, regularizer, optimizer)
• modify training/test data parameters (data size, data composition)
• train the model
and evaluate model performance (visualization of accuracy, precision, recall, false positive, false negative, ROC metrics) as each parameter is changed.
Victor Dibia & Nisha Muktewar are both Research Engineer at Cloudera.


27 t/m 29 oktober 2025Praktische driedaagse workshop met internationaal gerenommeerde trainer Lawrence Corr over het modelleren Datawarehouse / BI systemen op basis van dimensioneel modelleren. De workshop wordt ondersteund met vele oefeningen en pra...
29 en 30 oktober 2025 Deze 2-daagse cursus is ontworpen om dataprofessionals te voorzien van de kennis en praktische vaardigheden die nodig zijn om Knowledge Graphs en Large Language Models (LLM's) te integreren in hun workflows voor datamodel...
3 t/m 5 november 2025Praktische workshop met internationaal gerenommeerde spreker Alec Sharp over het modelleren met Entity-Relationship vanuit business perspectief. De workshop wordt ondersteund met praktijkvoorbeelden en duidelijke, herbruikbare ri...
11 en 12 november 2025 Organisaties hebben behoefte aan data science, selfservice BI, embedded BI, edge analytics en klantgedreven BI. Vaak is het dan ook tijd voor een nieuwe, toekomstbestendige data-architectuur. Dit tweedaagse seminar geeft antwoo...
17 t/m 19 november 2025 De DAMA DMBoK2 beschrijft 11 disciplines van Data Management, waarbij Data Governance centraal staat. De Certified Data Management Professional (CDMP) certificatie biedt een traject voor het inleidende niveau (Associate) tot...
25 en 26 november 2025 Worstelt u met de implementatie van data governance of de afstemming tussen teams? Deze baanbrekende workshop introduceert de Data Governance Sprint - een efficiënte, gestructureerde aanpak om uw initiatieven op het...
26 november 2025 Workshop met BPM-specialist Christian Gijsels over AI-Gedreven Business Analyse met ChatGPT. Kunstmatige Intelligentie, ongetwijfeld een van de meest baanbrekende technologieën tot nu toe, opent nieuwe deuren voor analisten met ...
8 t/m 10 juni 2026Praktische driedaagse workshop met internationaal gerenommeerde spreker Alec Sharp over herkennen, beschrijven en ontwerpen van business processen. De workshop wordt ondersteund met praktijkvoorbeelden en duidelijke, herbruikbare ri...

Deel dit bericht