


Whereas companies think about processes from their frame of reference, "cutting" processes up according to department, business objective or other internal aspect, customers obviously do not act according to the same taxonomy and - from the perspective of the company - appear to jump from process to process, from department to department and from channel to channel, making it hard for businesses to truly follow a customer through their whole journey.
As such, many organizations have adopted the concept of Customer Journey Mapping, or Customer Journey Analytics in order to map out the customer’s experience and analyze it. From initial contact with the company through the steps of engagement and finally into a long term relationship. Such techniques are for instance frequently applied to analyze the “onboarding” of customers, where customers might first look up information on the web, rely on word-of-mouth, check out your mobile app, make some calls or visit branches, before committing to a particular purchase of a product of service.
Obviously, making sense of the customer’s motivations and expectations can help a great deal in figuring out how to increase sales, uptake, quality, etc. Customer journey maps help to uncover gaps between devices (users move from their phone to their tablet to their computer), between departments (e.g. the customer gets forwarded from the sales to the invoicing to the support department, all working with different identifiers, frustrating the customer) and between channels (e.g. a customer interacts with your social channels such as Facebook, your web site, your mobile app, your call center, and can jump between them). These gaps are oftentimes not apparent when thinking about processes from an internal, business-centered point of view, but stand out in a customer journey analysis, where the user or customer is put at the center of thinking.
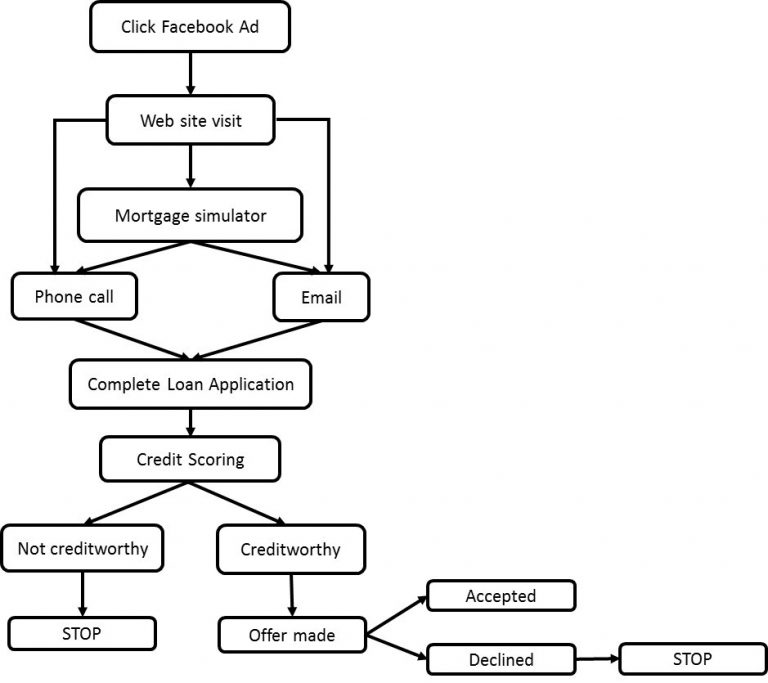
There are different analytical approaches to construct an analyze a customer map. In essence, a customer journey map is a diagram representing the various steps the customers go through when engaging with a firm (Richardson, 2010). Hence, it should be visual, indicating some sort of behavioral flow. The figure below shows an example of a simplified customer journey for a mortgage sales process. It illustrates the various activities, states and transactions that a customer can be in when buying a mortgage. Transition probabilities and time indicators are usually added for further enrichment of the analysis.
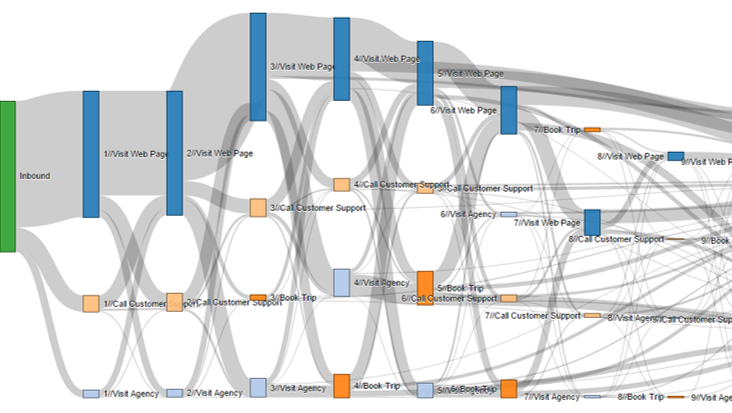
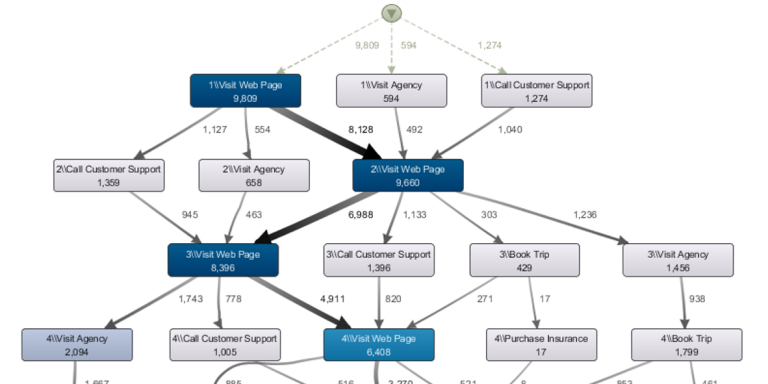
Another frequently applied way to depict customer journeys is by means of a Sankey diagram: a visualization used to depict a flow from one set of values to another. Such diagrams are oftentimes used for web analytics as well. The figures below show some examples:
From an analytical perspective, sequence rule mining can be a first approach to discover customer journeys. A more mature discipline of analytical techniques for customer journey mapping is the field of process mining and discovery (van der Aalst, 2016). The idea here is to start from an event log of activities as depicted in the table below. The event log depicts a unique customer identifier, the various activity names and time stamps. Process discovery techniques such as HeuristicsMiner, Fodina (vanden Broucke et al. 2017), or Disco (commercial) can then be used to discover the underlying process model or customer journey. For more information on process mining and discovery techniques, we refer to van der Aalst (2016).
| Customer | Activity Name | Timestamp |
| … | ||
| Bart | Click Facebook Ad | 20-06-2017 14:02:06 |
| Seppe | Mortgage simulator | 20-06-2017 15:15:54 |
| Bart | Creditworthy | 21-06-2017 09:54:24 |
| … |
Various challenges arise when doing customer journey analysis. First of all, it is important that all events are properly tracked across the various customer touch points using e.g. JavaScript plug-ins on a web page of event capture libraries for mobile apps. It is recommended to capture all events at the lowest level of granularity. During the analysis, the complexity can be reduced by using appropriate aggregation operations as decided in collaboration with the business user. Furthermore, a customer should be uniquely identifiable across all touch points such that the corresponding information can be correctly matched.
Many firms will start doing customer journey analysis by focusing on one channel only, such as the web. Using data collected through JavaScript page tagging, web logs and cookies, firms can do clickstream analysis and understand how customers navigate through their website. More specifically, they can find out where customers come from, what search engines and search terms they used (if any), what was their first page (also called landing page), what were the other pages in their session or visit, and where did they drop out and at what time. As another example, consider an on-line sales process which may consist of the following steps: add items to basket, check out, provide personal details, provide payment details, review order, and confirm order. Customer journey analysis can be used to analyze how long customers spend in each of these stages and where and whereto they drop out. The analysis can be further enriched by performing segmentation and considering how different segments of customers in terms of e.g. geographic region, referrer, or gender (if available) may have different customer journeys.
• De Weerdt J., De Backer M., Vanthienen J., Baesens B., A Multi-Dimensional Quality Assessment of State-of-the-Art Process Discovery Algorithms using Real-Life Event Logs, Information Systems, Volume 37, Issue 7, pp. 654-676, 2012.
• Richardson A., Using Customer Journey Maps to Improve Customer Experience, Harvard Business Review, 2010.
• Van der Aalst, W. M. P., Process Mining: Data Science in Action, Springer-Verlag, Heidelberg, 2016.
• Vanden Broucke, S. K. L. M., De Weerdt J., Fodina: a robust and flexible process discovery technique, http://www.processmining.be/fodina/, 2017.
Bart Baesens spreekt op dinsdag 28 maart tijdens de DW & BI Summit 2017.


27 t/m 29 oktober 2025Praktische driedaagse workshop met internationaal gerenommeerde trainer Lawrence Corr over het modelleren Datawarehouse / BI systemen op basis van dimensioneel modelleren. De workshop wordt ondersteund met vele oefeningen en pra...
29 en 30 oktober 2025 Deze 2-daagse cursus is ontworpen om dataprofessionals te voorzien van de kennis en praktische vaardigheden die nodig zijn om Knowledge Graphs en Large Language Models (LLM's) te integreren in hun workflows voor datamodel...
3 t/m 5 november 2025Praktische workshop met internationaal gerenommeerde spreker Alec Sharp over het modelleren met Entity-Relationship vanuit business perspectief. De workshop wordt ondersteund met praktijkvoorbeelden en duidelijke, herbruikbare ri...
11 en 12 november 2025 Organisaties hebben behoefte aan data science, selfservice BI, embedded BI, edge analytics en klantgedreven BI. Vaak is het dan ook tijd voor een nieuwe, toekomstbestendige data-architectuur. Dit tweedaagse seminar geeft antwoo...
17 t/m 19 november 2025 De DAMA DMBoK2 beschrijft 11 disciplines van Data Management, waarbij Data Governance centraal staat. De Certified Data Management Professional (CDMP) certificatie biedt een traject voor het inleidende niveau (Associate) tot...
25 en 26 november 2025 Worstelt u met de implementatie van data governance of de afstemming tussen teams? Deze baanbrekende workshop introduceert de Data Governance Sprint - een efficiënte, gestructureerde aanpak om uw initiatieven op het...
26 november 2025 Workshop met BPM-specialist Christian Gijsels over AI-Gedreven Business Analyse met ChatGPT. Kunstmatige Intelligentie, ongetwijfeld een van de meest baanbrekende technologieën tot nu toe, opent nieuwe deuren voor analisten met ...
8 t/m 10 juni 2026Praktische driedaagse workshop met internationaal gerenommeerde spreker Alec Sharp over herkennen, beschrijven en ontwerpen van business processen. De workshop wordt ondersteund met praktijkvoorbeelden en duidelijke, herbruikbare ri...

Deel dit bericht